
Power exploration
You can find this tool in the Consumption section, under the Power exploration tab.
You can visualize how self-consumption rate and self-sufficiency rate change with installed power for the defined consumption.
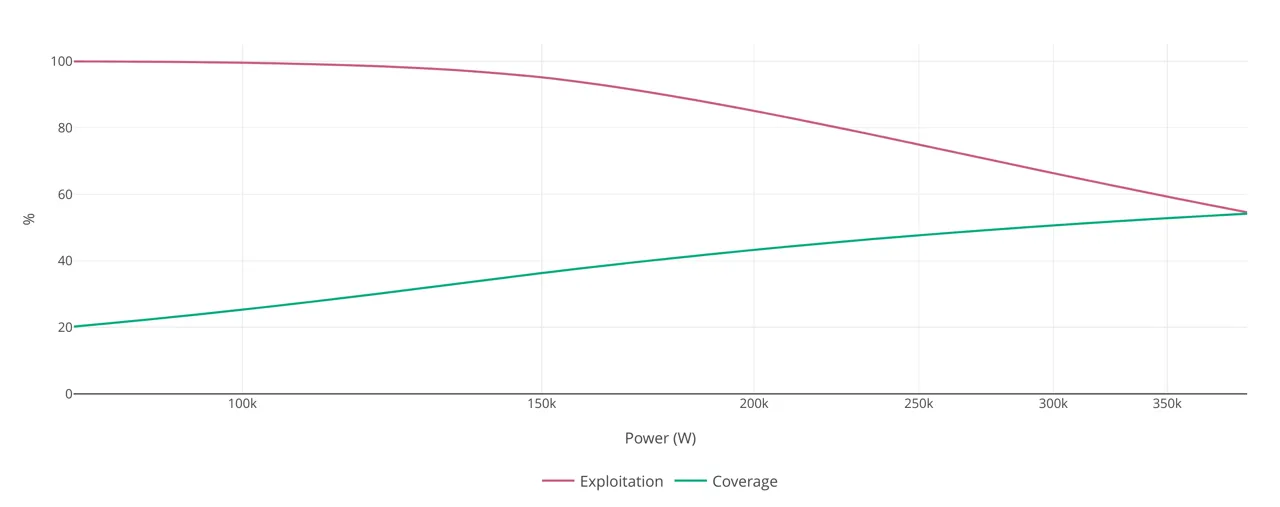
This way you can skip unnecessary iterations by quickly understanding how the installed power is going to affect the results of your design.
You can manually modify both the tilt and the orientation of the modules to see how they affect your project. Apart from those parameters, the exploration also takes into account all other relevant parameters like the location and the selected modules.
The exploration simulates different installed power levels within the following range:
The range starts where the self-consumption rate begins to decrease slightly (typically from 100%). Below this point, reducing installed power would simply reduce the self-sufficiency rate linearly.
The range ends where the self-consumption rate equals the self-sufficiency rate. At this point, the installation produces as much total energy as is consumed over the same period. This point can be interesting for net metering or high-capacity battery use cases.